Компоненты AD в кризис
ВВП и национальные счетаМакроэкономическое равновесие: AD–AS и IS–LMДанные, статистика и причинность
★★★★☆
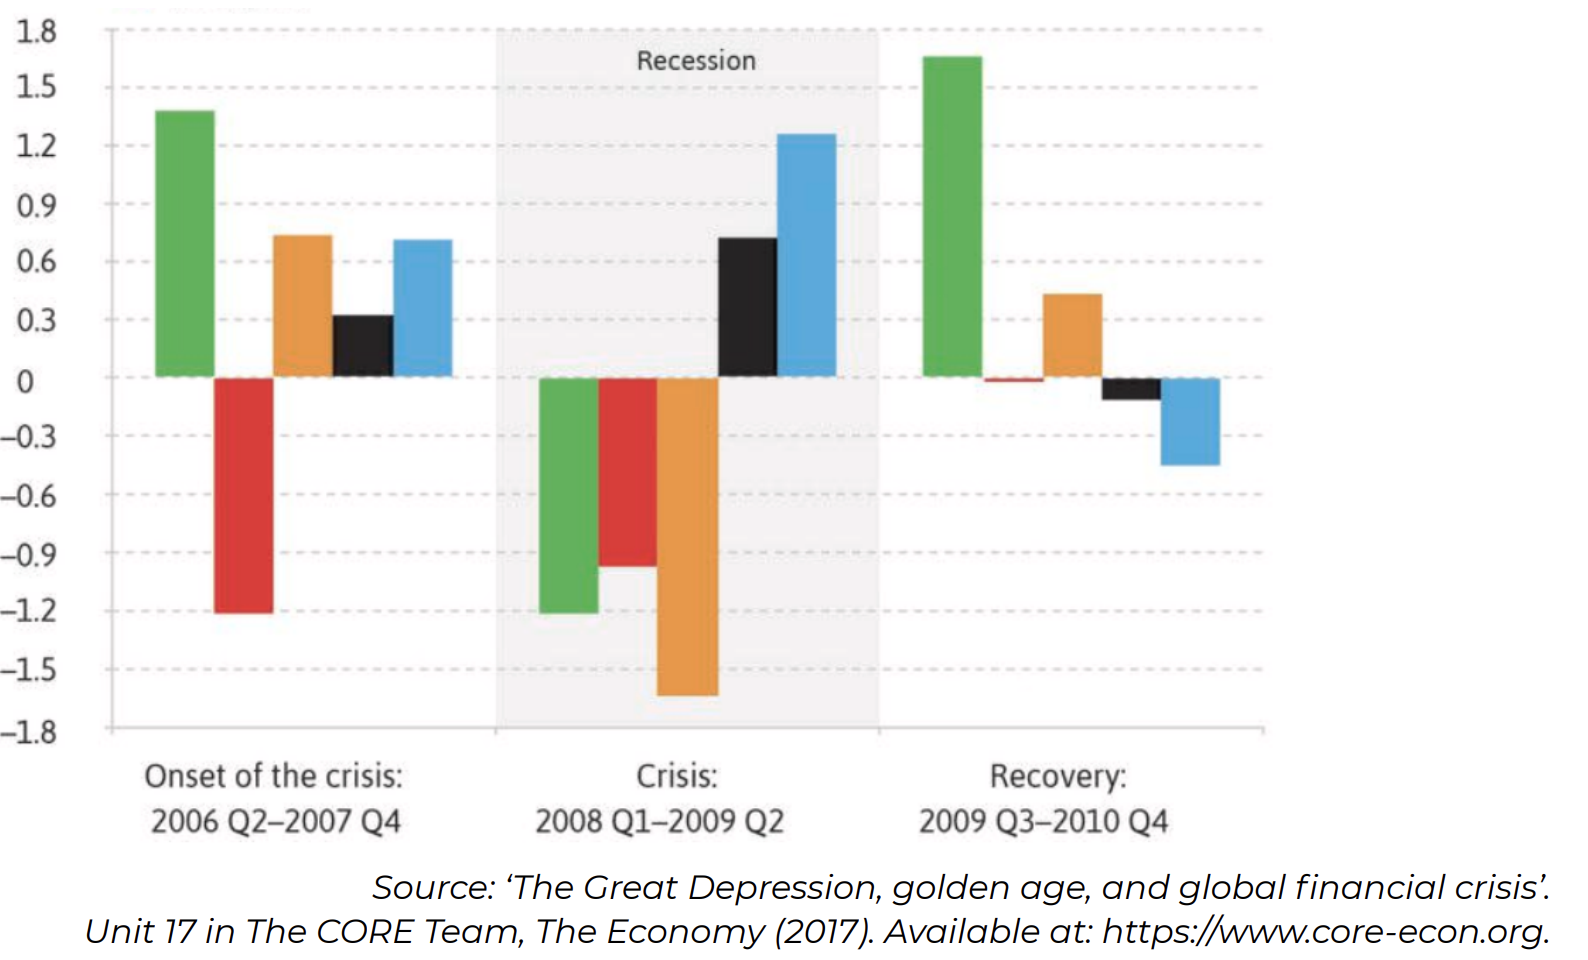
In this diagram, you can see the contribution of different components of the aggregate demand to the U.S. GDP change during the global financial crisis (in annual percentage points). The bars represent government spending, net exports, private consumption, residential and non-residential investment.
Не то попробуйте другой вариант
Верно
Правильный ответ: . Ниже видно, что вы отмечали и что надо было.
попытка 1
1–4 выбрать · Enter проверить